Measurement uncertainty budget according to GUM
The estimation of measurement uncertainty is described in numerous documents. The ISO Guide to the Expression of Uncertainty in Measurement is the central document here, and its application is explained in many other papers. For the field of chemical analysis, this has been done in the EURACHEM/CITAC Guide Quantifying Uncertainty in Analytical Measurement, of whose previous edition a German translation is also available.
The process of measurement uncertainty estimation can be divided into 4 stages:
Related to an uncertainty estimation, the " specification of the measurand" requires, on the one hand, a clear and unambiguous representation of what is to be measured and, on the other hand, a quantitative expression relating the value of the measurand to the parameters on which it depends. This is the only way to ensure that as many sources of uncertainty as possible can be identified. The "quantitative expression" should describe as a formula how a parameter is related to the measurand, e.g.

Parameters which are not directly included in the measurement result, but which nevertheless contribute to the uncertainty of the result, can be included as factors having the value 1 with an uncertainty to be quantified. From the correlation between the individual parameters, it is possible to capture the influence of the respective quantities on the overall uncertainty.
In the previous stage, it was determined which parameters make up the measurand. Now it must be determined which sources of uncertainty these individual parameters have. The following are examples
- for weighing: e.g. calibration uncertainty of the balance, precision of the balance, buoyancy correction
- for volume measurements: e.g. calibration uncertainty of the volumetric instrument, reading/filling precision, temperature,
- purity of chemicals
- for high precision measurements: Uncertainties of table values of densities, atomic weights, etc.
For the graphical representation of the relationships, one can create so-called fishbone diagrams showing the relationships, e.g. for an acid/base titration:
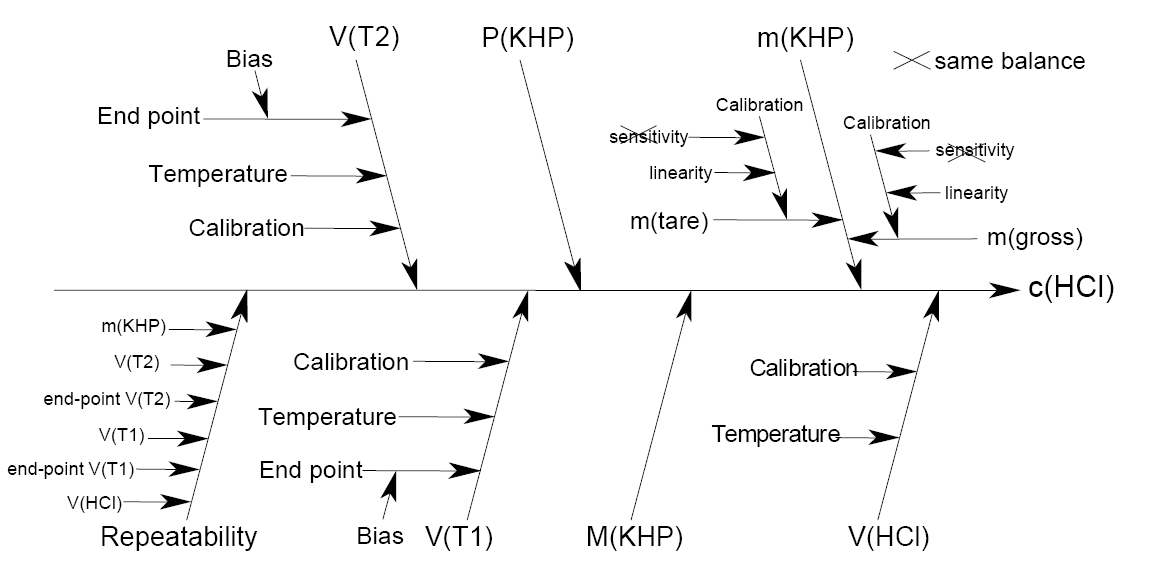
(from EURACHEM/CITAC-Guide)
The uncertainty contributions are now all to be quantified at the standard deviation confidence level. For contributions that are determined from statistical data or for which a normal distribution can be assumed for other reasons, the standard deviation is used directly as the standard measurement uncertainty. If mean values from several measurements are used, the standard deviation of the mean value (i.e. s/√n) is to be used here. If nothing is known about the distribution of possible values, e.g. when specifying the volume of a volumetric instrument or the purity of a substance, a rectangular distribution can be assumed. Then the standard deviation is obtained by dividing half the width by the square root of 3. If the probability is greater that the value is near the center of the specified interval, a triangular distribution can also be assumed. Then the standard deviation is equal to half the width divided by the square root of 6.
The standard uncertainties of the individual parameters must now be converted into uncertainties of the measurement result, due to the influence of the uncertainty of the individual parameter. Thus, it must be taken into account how much the uncertainty of the parameter affects the uncertainty of the result. These sensitivity coefficients can be determined for all parameters of the input equation from step 1 by partial differentiation of the equation according to this parameter. A numerical calculation is also described in the EURACHEM/CITAC guide. Thus, after multiplying the uncertainty component for parameter P quantified above by its sensitivity coefficient, the standard uncertainty contribution for the measurement result due to parameter P is obtained.
These standard uncertainty contributions are combined into a combined standard uncertainty according to the error propagation law:

In order to get a higher confidence level of the uncertainty statement, the combined standard uncertainty is now multiplied by a coverage factor. The most commonly used coverage factor k=2 results in a confidence level of approx. 95%.