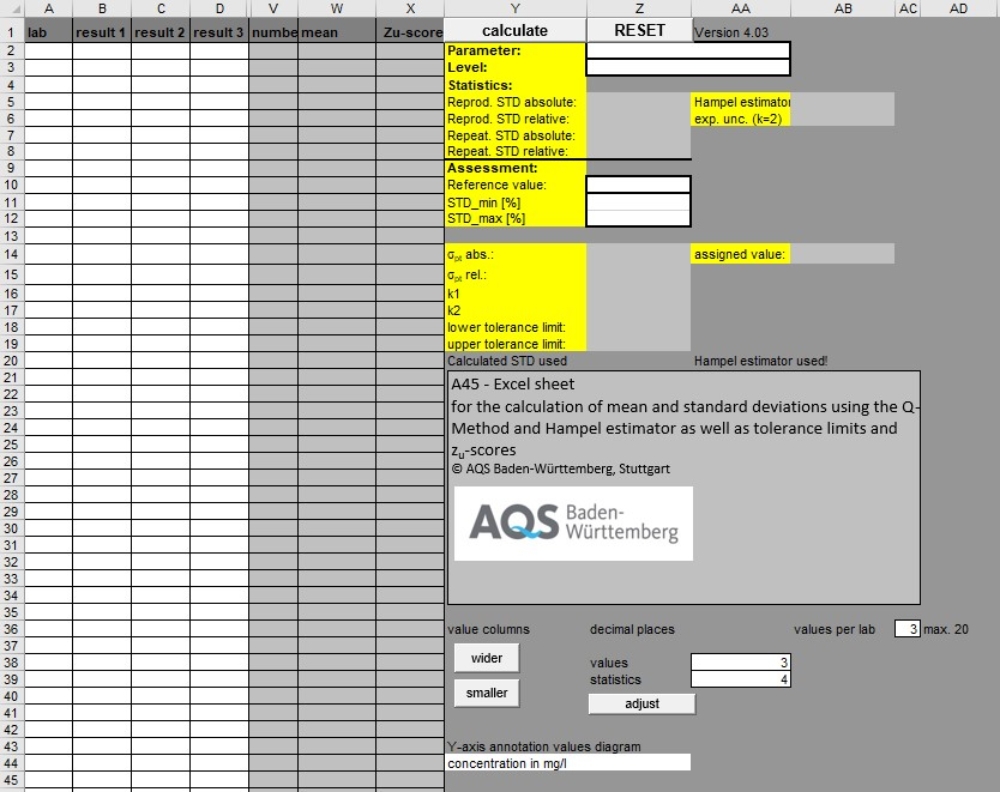
Downloads

In our download area you will find:

In June 2014, the standard DIN 38402 - A45 "Proficiency tests for external quality control of laboratories", which was first published in September 2003, was revised. This standard requires to use the combined estimation procedure QHampel for estimating standard deviation and mean value as a procedure of robust statistics and zU-scores for the evaluation of the individual values. These procedures have also found their way into ISO/TS 20612:2007, and the QHampel procedure can also be found in DIN ISO 13528:2020.
AQS Baden-Württemberg has created an evaluation program based on an Excel macro that you can purchase for € 500 plus VAT.
If you are interested, please contact AQS Baden-Württemberg at ISWA directly (info@aqsbw.de).

General

The macro is used for statistical evaluation of proficiency tests according to DIN 38402 - A45:9/2003 or ISO/TS 20612:2007 or DIN ISO 13528:2020.
The Q-method is used to calculate the standard deviation, the Hampel estimator is used to calculate the mean value.
Both are methods of robust statistics.

Functionality and operation

The screen layout of the macro is shown in the figure above.


The cells with white background can be filled in. Column A with an identification of the laboratory, columns B-U with the results of up to 20 parallel measurements, in cell Z2 an identification of the proficiency test and in cell Z3 an identification of the sample.
By clicking the "calculate" button, the statistical calculations are started and then displayed in cells Z5-Z8 and AB5-AB6.
The laboratory mean values are evaluated by means of zU scores calculated on the basis of the Hampel estimator and the standard deviation from the Q method. A program version for the use of z-scores is also available. If the assessment is to be made with respect to a reference value, this can be specified in cell Z10. If the standard deviation is to be limited, upper and lower limits can be entered in cells Z11 and Z12. If the evaluation is to be carried out on the basis of a target standard deviation, this must be entered in Z11 and Z12.

System requirements

The macro is based on Microsoft EXCEL. The further system requirements depend on the requirements of Microsoft EXCEL.

Here we offer some EXCEL programmes for quality control charts and for the estimation of measurement uncertainty as well as assisting programmes for the evaluation of PTs.

EXCELKONTROL

Quality control charts are important and helpful tools of internal quality control in analytical laboratories. Therefore they are widely used and required by international standards such as ISO/IEC 17025

ExcelKontrol is a simple Excel® macro, intended for the daily operation of quality control charts in the laboratory.

With ExcelKontrol you may operate x-charts, r-charts, r%-charts, blank charts, differences charts and recovery charts.

All types of charts may be used as Shewhart-charts (with statistically determined limits) or as target charts. In the latter case the limits are defined by external quality requirements independent from the data.

Improvement of the program: If you have suggestions for improvement of the program or you want to report bugs, you are invited to contact the authors. We gratefully acknowledge any support.

Save the file ExcelKontrol_2.4_setup_en.zip to your computer. The file must be unzipped, then you may install the programm with a double click on "ExcelKontrol_2.4_setup_en.exe". Please consider the EXCEL macro security options for the excution of EXCEL macros. You will find more details in the info text shown during installation or in the manual.

ExcelKontrol is available in German as well as in English.

Estimation of measurement uncertainty from validation and quality control data

  • In the NORDTEST- Handbook for calculation of measurement uncertainty in environmental laboratories as well as in ISO 11352 on the estimation of measurement uncertainty based on validation and quality control data a procedure for the estimation of measurement uncertainties is presented. We have implemented these calculations in an EXCEL workbook. At present two versions are available:

Estimation of uncertainty from sampling

Assisting programmes for the evaluation of PTs

If you have questions regarding these programmes, please do not hesitate to contact us.

 
To the top of the page