The NORDTEST approach
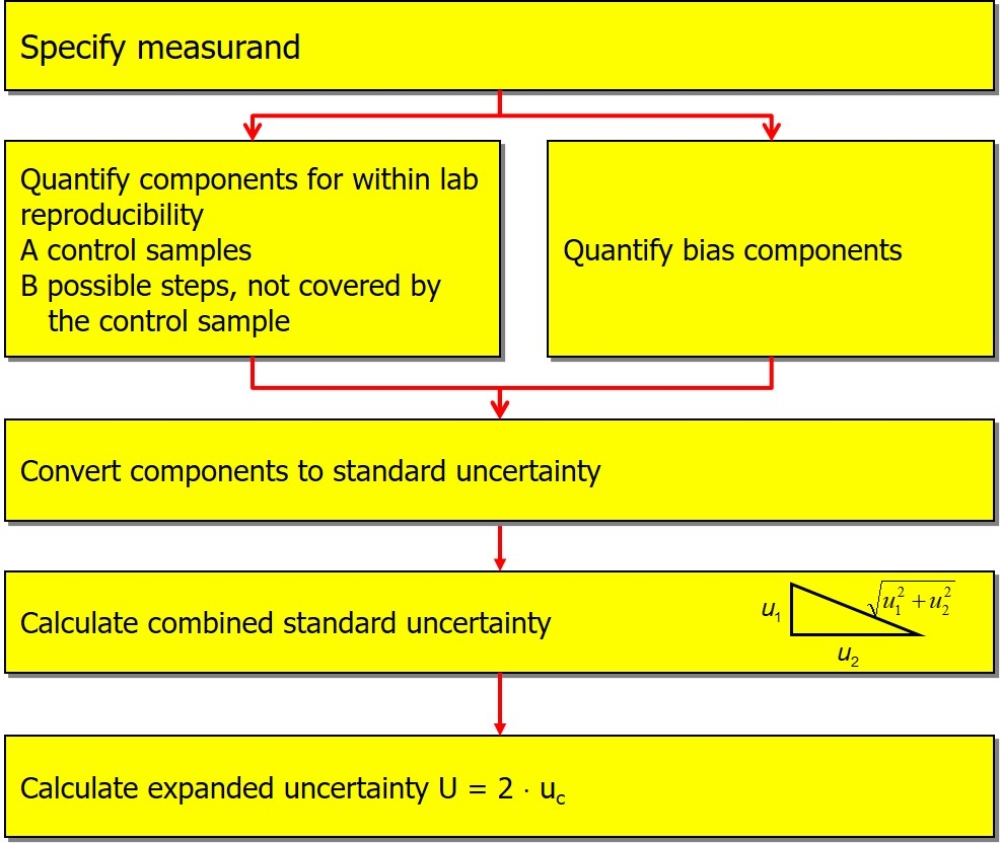
The NORDTEST Handbook for calculation of measurement uncertainty in environmental laboratories describes a procedure that uses data from routine quality assurance and validation to estimate measurement uncertainty. Thus, it is not attempted here to divide the measurement procedure into the smallest possible steps and then quantify the individual uncertainties. Rather, an attempt is made here to determine all contributions to a statistical deviation and all those leading to a systematic deviation, in each case integratively from the above-mentioned data. This approach has also been implemented DIN ISO 11352.
The basic procedure is shown in the diagram above.
The determination should take place under the conditions that also apply to routine analysis. These are not repeatability conditions, and also not reproducibility conditions, but intermediate conditions. These conditions are fulfilled for control charts, for example.
Possibility 1: from control samples covering the entire analytical process
If the control sample covers the entire analytical process (including sample preparation) and the matrices of the control sample and routine samples are similar, then uRw can be estimated directly from the analytics of the control samples (control chart). For large concentration ranges, several control samples of different concentrations should be used.
uRw = sRw
Possibility 2: from control samples for deviating matrices and/or concentrations.
If a synthetic control sample is used and the matrices of the control sample and the routine samples are not similar, then the uncertainty contributions resulting from the different matrices must be additionally included. These can be estimated from the repeatability at different matrices (range control chart).
Option 3: from unstable control samples
If there is no stable control sample (e.g. oxygen measurement), then initially only uncertainty contributions can be estimated from repeatability (span control chart). The long-term components (from series to series) must be added, for example, via an expert estimate from experience.
This can be estimated from:
- the analysis of certified reference materials
- participation in proficiency tests or
- from recovery experiments.
Sources of systematic deviation should always be eliminated, if possible. If the systematic deviation is significant and based on reliable data (e.g. CRM), the measurement result should be corrected accordingly. Systematic deviations may depend on the matrix. This can be checked by using reference materials that differ in the matrix.
The uncertainty component consists of further individual components:
- the deviation itself (e.g. in % difference from the target value or certified value) and, if applicable, the uncertainty of the determination of this deviation
- the uncertainty of the standard value or certified value uCref
ubias can be estimated from the combination of these two components:

or, if necessary, taking into account the uncertainty of the determination of the deviation.
Option 1: Use of one certified reference material
bias - from the mean value of the deviations of the multiple analysis of the reference material
sbias - the standard deviation of the multiple analysis of the reference material
nM - the number of measurements of the reference material
uCref - the standard uncertainty of the reference material (taken from the certificate)
Option 2: Use of several certified reference materials
The analysis of several reference materials provides mean deviations for each ref. material i. From these deviations biasi and the number of analyzed reference materials as well as the standard uncertainty of the certified value, ubias can again be calculated according to the above equation.
Option 3: Use of proficiency test results
The uncertainty of the default value of proficiency tests results, if the default value was calculated from the mean value of the participants, to:

or, if the median or robust estimation methods were used for calculation, according to ISO 13528:
If other methods were used to determine the default value, the uncertainty of the default value must be requested from the proficiency test provider.
In order to get a reasonably clear picture of the deviations of a laboratory, the laboratory should have analyzed at least six proficiency test samples within a reasonable period of time.
For the analysis of these proficiency test samples, the respective deviations biasi from the standard value are determined. The uncertainties of the standard values are averaged for further calculation.
ubias then results in:
where nR is the number of proficiency test samples used.
Option 4: Use of results of recovery experiments
Recovery experiments are often performed in the validation or verification of analytical methods. In these experiments, a sample is spiked with the analyte and measured both before and after spiking. The recovery can then be calculated from the difference between the measurements and the amount of analyte added. If no systematic deviation occurs, the mean value of several spiking experiments should be 100%.
Of course, the amount of analyte added is also subject to uncertainty here.
As an example, the spiking of a real sample with a standard solution (with manufacturer's certificate) using a micropipette is shown here. The uncertainty of the concentration of the standard solution results directly from the manufacturer's certificate. There we find the specification ± 1.2% (confidence level 95%). To convert to a standard uncertainty, we must divide this value by 1.96 and obtain approximately:
uconc = 0.6 %
Information from the micropipette manufacturer is used to estimate the uncertainty of the added volume. The manufacturer specifies a max. deviation of 1% as systematic error and a standard deviation of max. 0.5% as repeatability (random error). The repeatability value can be used directly, the max. deviation must be converted into a standard deviation. Since all values in the range ± 1 % must be assumed as equally probable, a rectangular distribution of the possible values is assumed. For a rectangular distribution with half width a, the standard deviation is calculated as a/√3. For the standard uncertainty of the added volume this results in:
The overall uncertainty of the spike is thus:
![]()
To calculate the total uncertainty of the deviation, the deviations in the recovery tests are now also used. For recoveries of e.g. 95%, 98%, 97%, 96%, 99% and 96%, deviations of 5%, 2%, 3%, 4%, 1% and 4% are then obtained.
As calculated above:
or in the example described:
The total standard uncertainty or combined standard uncertainty uc is calculated by combining the uncertainty component due to random deviations uRw with the uncertainty component due to systematic method and laboratory bias ubias.
This value indicates the estimated uncertainty of the measured value at the standard deviation confidence level (approx. 68%). To convert to a higher confidence level, this value can be multiplied by a coverage factor k. The choice of k determines the level of confidence.
In practice, a coverage factor of k=2 has become generally accepted. This corresponds to a confidence level of about 95%.
If the data for the calculations shown are not available and if the requirements for measurement uncertainty are only relatively small, then a rough estimate of measurement uncertainty can be derived directly from the reproducibility standard deviation of interlaboratory comparisons. Then we set
uc = sR
where sR is the reproducibility standard deviation from an interlaboratory comparison.
So we get:
U = 2 ∙ SR
This estimate could - depending on the quality of the laboratory - be too high ("worst case"). However, it could also be too low due to greater inhomogeneities of the real samples compared to the interlaborytpory comparison samples or other matrices.